Portfolio Analysis Report
IACC Autism Spectrum Disorder Research
2013
What areas of ASD research were funded in 2013?
To better understand what areas of research were funded in 2013, projects were aligned with the corresponding questions in the 2011 IACC Strategic Plan. Figure 7 illustrates the breakdown of the research funding according to the Strategic Plan’s seven questions related to Screening and Diagnosis (Q1), Biology (Q2), Risk Factors (Q3), Treatments and Interventions (Q4), Services (Q5), Lifespan Issues (Q6), and Infrastructure and Surveillance (Q7). Identifying how current research investments correspond to the Strategic Plan provides an understanding of how funders have directed investments across each of the priority areas identified by the IACC, as well as an indication of which areas are well supported versus those that may be in need of additional attention or development.
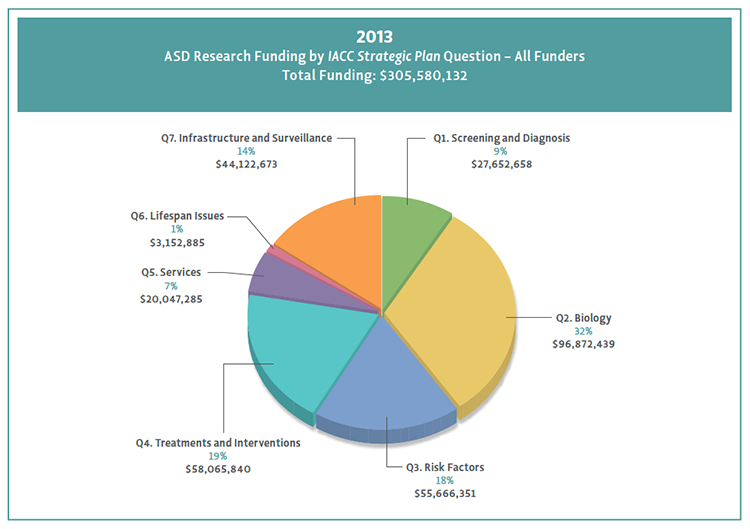
Figure 7. Topic areas are defined by each question in the IACC Strategic Plan. The seven questions of the Strategic Plan are represented in the clockwise direction, beginning with Screening and Diagnosis (Question 1) and ending with Infrastructure and Surveillance (Question 7).
ASD research funding in 2013 supported projects relevant to all seven of the critical questions in the IACC Strategic Plan for ASD Research. As in previous years, the largest portion of funding addressed the underlying biology (Question 2) of ASD (32%). This was followed by research into treatments and interventions (Question 4) for ASD (19%), including behavioral therapies, pharmacological treatments, and technology-based interventions. Question 3, research aimed at identifying potential causesand risk factors for the disorder, followed closely with 18% of total funding. Investment in research infrastructure and surveillance (Question 7) stayed the same as 2012 at 14%. Research to improve screening and diagnosis (Question 1) of ASD showed the largest change —a 2% decrease —from 11% in 2012 to 9% in 2013. Research focused on services (Question 5) and lifespan issues (Question 6) remained the smallest areas of funding (7% and 1%, respectively). The percentages of funding for each question were similar to those seen in 2012.
When the number of active projects that align with each question, as opposed to the total funding for these projects is considered, the distribution is subtly different due to differences in the relative sizes of projects falling under each of the seven question categories. In 2013, the percentage of total projects aligned with each question were as follows: Question 1, 10%; Question 2, 37%; Question 3, 11%; Question 4, 20%; Question 5, 10%; Question 6, 2%; Question 7, 9% (Figure 8). For example, the number of projects aligning with Question 5 is considerably greater than might be expected based on the proportion of overall funding aligning with this question, demonstrating that individual projects in this area tend to be smaller in size. In contrast, there are fewer projects aligning with Question 3 and Question 7 than might be expected based on the percentages of funding. This indicates that the size of the awards for infrastructure and surveillance projects (Question 7) and projects related to investigation of risk factors (Question 3) tend to be larger, reflecting the greater cost that would be expected for carrying out research in these areas, which often require large-scale studies (Question 3) and database/biobank development and maintenance (Question 7). Figure 8 shows the distribution of active projects among the Strategic Plan questions.
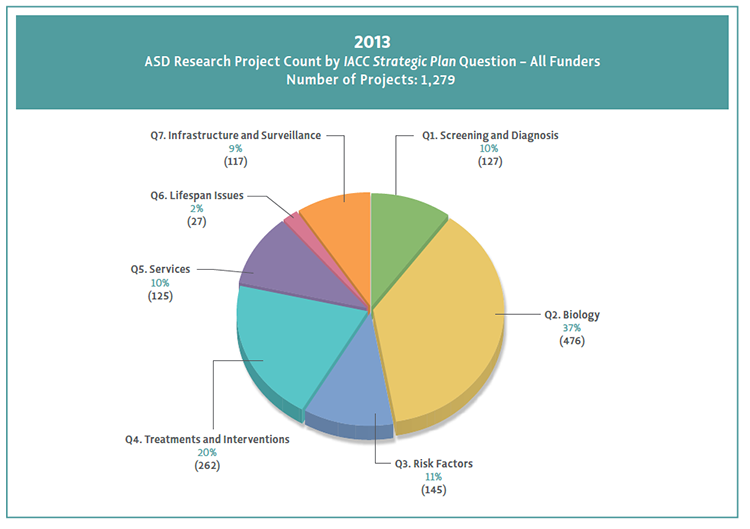
Figure 8. 2013 projects aligned to Strategic Plan questions.
How many new research projects were added in 2013 compared to ongoing research?
Each project included in the Portfolio Analysis is classified as either “Ongoing” or “New.” Ongoing projects were active in the previous year (2012), and new projects became active and received funding for the first time in the current year of the analysis (2013). In 2013, approx¬imately 77% of overall ASD research funding went to ongoing projects while 23% went to new projects. Since most research projects are funded for a duration of mul¬tiple years of work, a larger number of ongoing projects compared with new projects would be expected.
However, it is interesting to note that research related to screening and diagnosis (Question 1) and research related to lifespan issues (Question 6) had higher proportions of funding devoted to new projects compared with the overall average. In contrast, funding for infra¬structure and surveillance (Question 7) had a higher portion of funding going to ongoing projects, which would be expected due to the long-term infrastructure and data resources these projects provide to the autism research community (Figure 9).
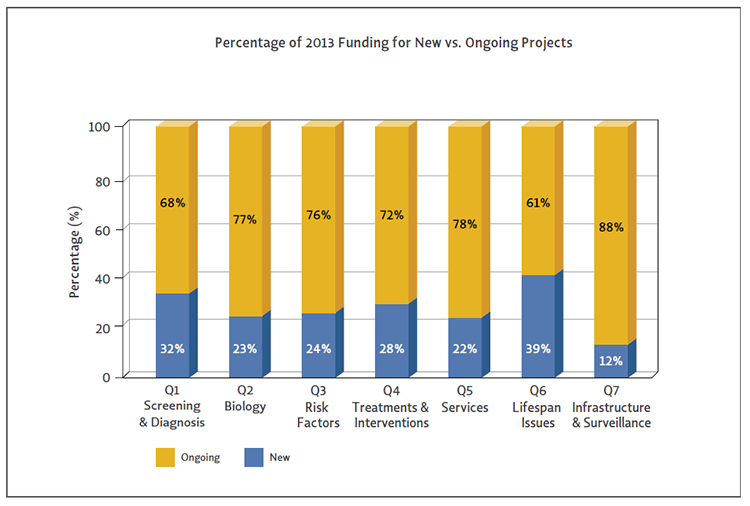
Figure 9. The percentages of ASD research funding going to new versus ongoing projects varies between Strategic Plan questions.
What types of research are funded by the different agencies and organizations?
The Federal and private funders included in this Portfolio Analysis Report fund a wide range of autism-related research projects. As shown in Figure 10, Federal and private funders contributed to funding for each of the question areas in the IACC Strategic Plan for ASD Research in 2013. However, the proportions of Federal and private funding varies by question area, suggesting that some areas align more closely with Federal or private priorities and/or capabilities. For example, infrastructure and surveillance projects (Question 7) received nearly equal support from Federal and private sources, while research on screening and diagnosis (Question 1) and services (Question 5) is largely supported by funding from Federal sources.
In addition to the variation in Federal and private support of research in each question area, the type of research represented in the portfolios of individual funders varies based on the mission of each individual agency or organization. Figure 11 depicts the proportion of funded projects for each agency and organization for each of the seven question areas of the IACC Strategic Plan. Figure 12 provides a graphic illustrating the breadth of the mission areas of the funding agencies and organizations included in the IACC Portfolio Analysis Report. While some agencies and organizations have broad portfolios that cover many different research areas described in the IACC Strategic Plan, others focus their efforts on a narrower range of research topics.
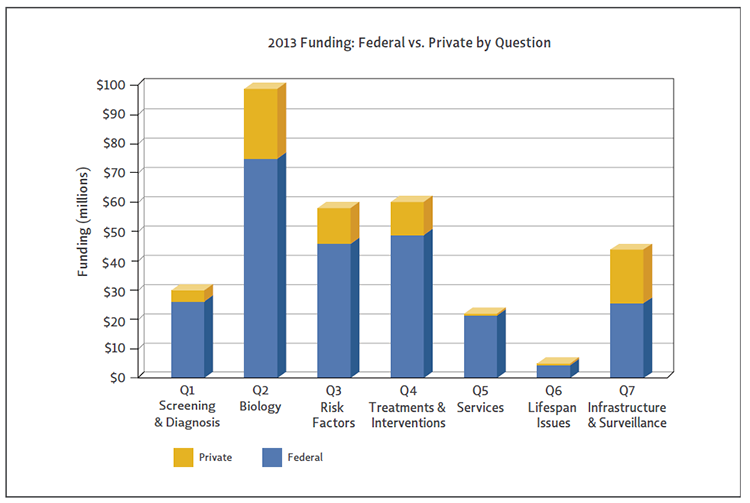
Figure 10. Federal and private funding was provided for each Strategic Plan question area in 2013, although the proportion of Federal vs. private funding varied between question areas.
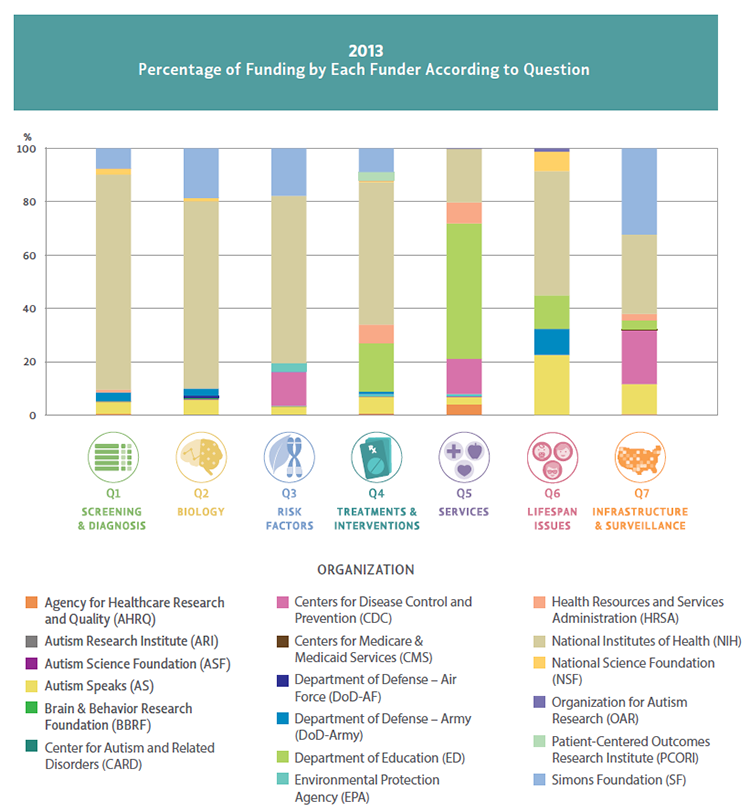
Figure 11. The proportion of each Federal agency and private organization's funding in the Portfolio Analysis organized by IACC Strategic Plan question for 2013. ACF was not included in this figure since they did not have any funding reported in 2013.
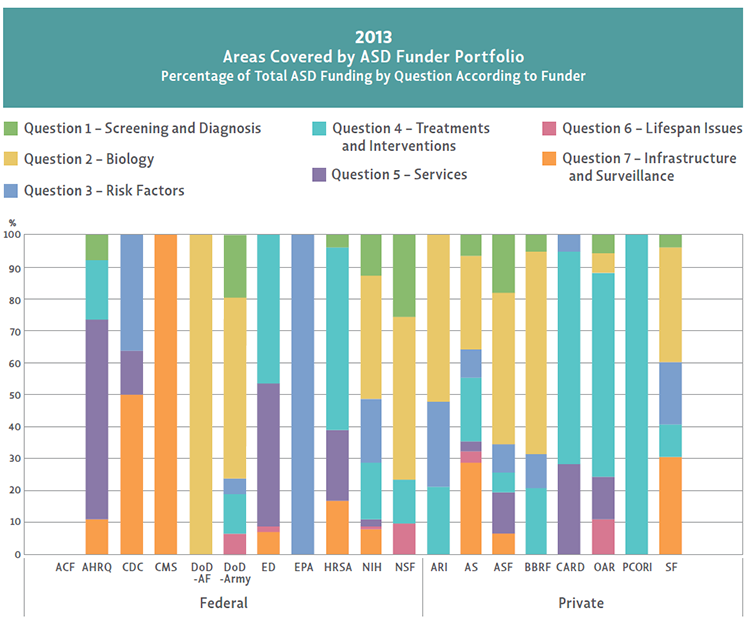
Figure 12. The portfolio of each Federal agency and private organization’s autism-related projects by Strategic Plan question for 2013. Please note that this figure is based on funding amount from 2013. Thus, while funders may support additional areas of research, that may not be reflected in this particular year. Note that the Administration for Children and Families (ACF) had one active project, and therefore is included in the analysis, but the active project received no funding in 2013.
How did the research projects funded in 2013 align with the objectives in the IACC Strategic Plan?
The 78 Strategic Plan objectives were developed by the IACC to set priorities for investment, and they represent areas where the Committee perceived gaps in research that required further research efforts. The 2013 autism research-related projects were matched with the best fitting research objective in the Strategic Plan, though in some cases, projects could only be assigned to a Strategic Plan question, and for the objective category, were assigned to Core/Other. The Core/Other category captures projects that may be related to crosscutting or “core” activities that help support the autism research field, projects in well-established areas of science that do not fit within the parameters of the specific research objectives outlined in the Strategic Plan, or projects that represent emerging areas of research. The Core/Other designation was developed by the IACC because the Committee felt it would help readers understand that even though activities in this category fall outside the specific research objectives of the Strategic Plan, they represent projects that are contributing in important ways to the progress of ASD research.
Analysis of the 2013 project portfolios to determine the proportion of projects that fit within Strategic Plan objectives versus the proportion that did not fit within Strategic Plan objectives (Figure 13) showed that in 2013, 25% of the funding went to projects that were not specific to a particular objective. In addition, Figure 14 shows that every question of the Strategic Plan included projects that were not specific to a particular objective (projects coded to Core/Other). Of all seven questions of the Strategic Plan, Question 2 contained the largest proportion of funding that did not align with any specific objective (47%). More detail on the types of research represented by projects that were categorized as Core/ Other can be found in the subsequent chapters of this report that are focused on each Strategic Plan question.
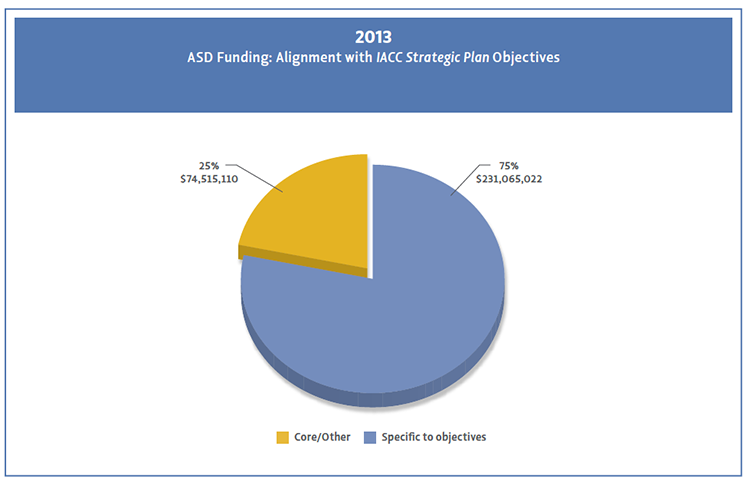
Figure 13. 25% of funding went to projects that were not specific to a particular Strategic Plan objective, and were designated Core/Other.
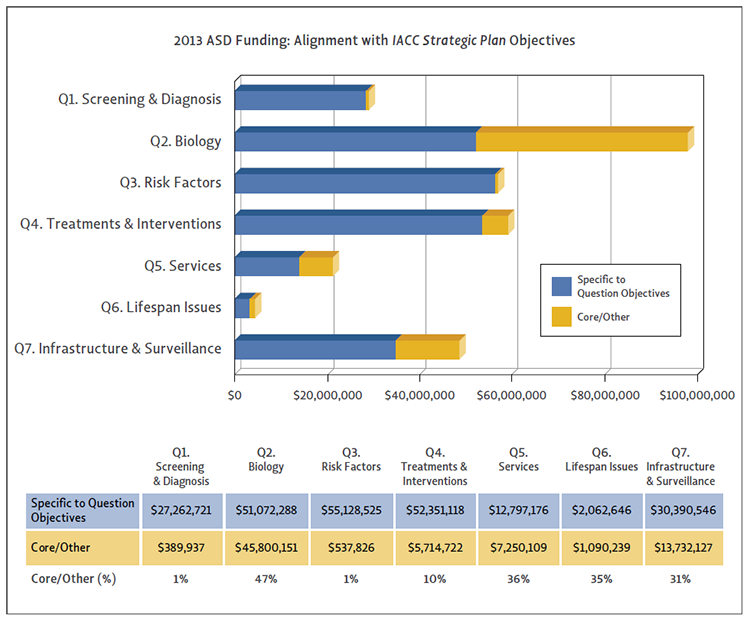
Figure 14. Each question in the Strategic Plan contained projects that were not specific to a particular objective, designated Core/Other. Funding for projects that fall under specific objectives are indicated in blue, and Core/Other projects are indicated in yellow. Subcategory analysis provided within the summary for each question of the Strategic Plan provides a description of the research areas addressed by all projects, including those assigned to Core/Other.
Summary of Progress toward IACC Strategic Plan Objectives
The 78 objectives in the Strategic Plan describe specific research priorities identified by the IACC, each with a goal date for initiation and a professional judgment estimate of the budget that may be required to accomplish the objective.1 Each ASD project that received funding in 2013 was evaluated with respect to the 78 objectives in the 2011 IACC Strategic Plan for ASD Research2 in order to determine which Strategic Plan question and objective it fulfilled. Analysis of the full portfolio of Federal government and privately funded projects aligned with the IACC Strategic Plan objectives yielded information about the progress that has been made toward completion of the objectives in the 2011 Strategic Plan. In 2013, this analysis indicated that of the 78 objectives in the IACC Strategic Plan, 95% (74 objectives) were underway or completed (green or yellow in the stoplight figure as explained below) (Figure 15). Further discussion of the progress toward achievement of individual Strategic Plan objectives is found in subsequent chapters of this report. The analysis also enabled assessment of areas of research where more work may be needed to achieve Strategic Plan objectives.
Upcoming chapters in this report give an overview of the progress on completing objectives in each question of the Strategic Plan in 2013. The overall progress for each question over the period from 2008-2013 is denoted by a stoplight figure at the end of each chapter. Within each stoplight figure, the number in the green light indicates the number of objectives that have been considered completed, the number in the yellow light indicates the number of objectives partially completed, and the number of objectives in the red light indicates the number of objectives where no progress has been documented through the portfolio analysis. Each of the chapters describing the progress in the seven Strategic Plan question areas also contains a table that provides information about the progress made toward completion of the Strategic Plan objectives over a six-year period from 2008 through 2013.
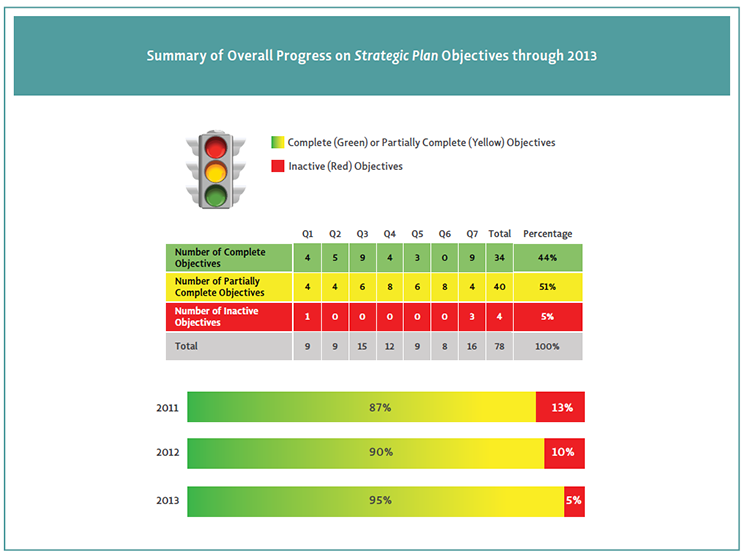
Figure 15. This figure provides the percentage of the total number of IACC Strategic Plan objectives that have been completed to date, based on an analysis of funded projects assigned to each of the Strategic Plan’s 78 objectives. As of 2013, 95% of objectives were either complete or partially complete (had all or some of the required funded projects), with 5% of objectives having no activity/assigned projects.
1Professional judgment budget estimates for each of the IACC Strategic Plan objectives were formulated by scientific and program experts in the field and provide an estimate of what it may cost to conduct each of the projects described. The IACC provided these budget recommendations as guidance to Federal agencies and partner organizations on the potential cost of conducting the recommended research. The IACC’s role in research is advisory, and the Committee does not have its own research budget to conduct or support research.
2The 2011 IACC Strategic Plan is the most recent update of the Strategic Plan where new objectives were added. The subsequent 2012 and 2013 Updates of the Strategic Plan did not include any edits to the objectives, therefore the objectives as described in the 2011 IACC Strategic Plan were used to code the 2013 projects to specific objectives.


