Publications Analysis
Autism Spectrum Disorder Research
The Global Landscape of Autism Research
2012
This chapter highlights where autism research is taking place and identifies key trends, including which countries are increasing their share of autism global output, the extent of collaboration between authors in different countries and different research institutions, and whether collaborative research results in higher impact autism publications.
To determine the geographic locations of autism-related research activities, the Web of Science® author address field was used to identify the research institution, country, and US state for each author on a given publication within the ASD publication set. Publications with multiple authors were therefore attributed to multiple addresses.
Publications that contained authors from multiple countries were also examined in detail. In this report, "collaboration" refers specifically to occurrences in which researchers from different institutions or different countries co-authored an autism publication. For example, if a publication was attributed to more than one country, country pairs were generated. This kind of co-authorship analysis serves as a general indicator of collaboration, but it does not capture all aspects of collaborative research. In addition, this study used citation count analyses to compare the impact of collaborative publications to those from single institutions or single countries. This provides one measure of whether multi-institutional and international collaborations are resulting in benefits to ASD research, with the assumption that more highly cited publications are being more widely disseminated and used within the research community.
This preliminary analysis of co-authorship and collaboration was performed in order to understand whether autism research is becoming a more global endeavor, and if so, if this may be beneficial to the field. It is often assumed that collaboration is especially beneficial for an emerging research field, such as autism, potentially providing researchers with access to a larger pool of expertise, participants, and resources than otherwise possible. Other analyses have provided support for the hypothesis that multi-institutional and international co-authorship collaborations can result in higher impact publications.22,23,24,25,26 Some exceptions to this trend, however, have also been reported. In particular, studies have shown that extensive geographic distance between co-authors may hamper citation impact in certain fields and in particular time periods.27,28 While the current analysis only provides a few targeted measures of collaborative activity, the results may serve as a foundation for further analyses of the implications and impacts of various types of collaboration on autism research.
Which countries are actively engaged in autism research?
Figure 18 is a heat map indicating the concentration of 2010 autism publications by country as well as the number of "collaborations," or more precisely, the number of times researchers from two countries were listed as authors on the same paper. The US, shaded in the darkest color of blue, had the largest number of autism publications (1,040). The map shows that US-international collaborations were extensive in 2010, with the most prominent collaborations occurring between the US and Canada as well as the US and the United Kingdom (31 to 40 shared publications each). In general, the highest levels of collaboration occurred between North America and Western Europe. Other countries with six or more international collaborations include Australia, New Zealand, Israel, Turkey, China, and South Korea. The complete list of country co-authorship pairs can be found in Appendix VI.
Extent of Global Autism Research and International Collaborations in 2010
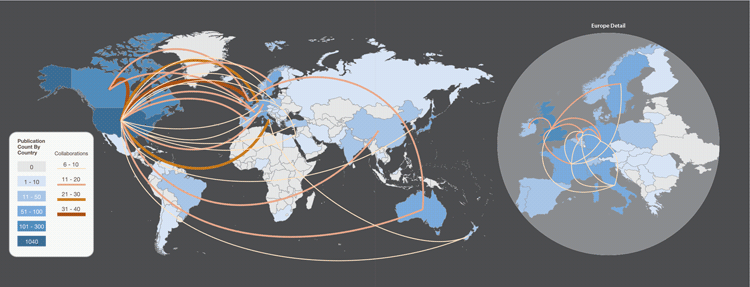
Figure 18. Extent of Global Autism Research and International Collaborations in 2010. Varying shades of blue indicate the total publication output for a country, with lighter shades representing fewer articles and darker shades indicating more articles. Countries in gray did not publish autism research in 2010. Connecting lines between countries represent author collaboration, where thicker and darker lines indicate a greater degree of shared publications between country pairs. For figure clarity, country pairs with five or fewer collaborations are not shown. Also for clarity, intra-Europe collaborations are not shown on the world map but can be seen in the "Europe Detail" inset.
Table 2 provides the publication counts for the top 25 most prolific countries publishing autism research in 2010. While the US leads in the number of ASD-related publications, the effort in 2010 was clearly global, with publications from authors in more than 50 different countries. To illustrate how research publication activity for each of the top 25 countries has changed in recent years, Table 2 also provides the publication counts for each country in the year 2000, as well as the fold growth in annual publication rate and the average annual increase in the number of publications since 2000. Over the last decade, the US, UK, and Canada have maintained the top three spots with respect to numbers of publications produced each year, but many developing countries have demonstrated stronger growth in publication activity. Starting from very low numbers in 2000, countries in Asia have shown some of the strongest fold growth in publication count since 2000, including China, Taiwan, India, and South Korea. Turkey has also increased substantially its publication activity, as have Brazil and Poland, which were not linked to any ASD research articles in 2000. The complete list of author countries publishing 2010 autism publications is provided in Appendix VII.
Top 25 Countries Publishing Autism Research in 2010
| Rank in 2010 | Author Country | Number of ASD Publications in 2000 | Number of ASD Publications in 2010 | Fold Growth From 2000 to 2010 | Average Annual Increase in Number of Publications Since 2000 |
|---|---|---|---|---|---|
Rank in 20101 |
Author CountryUnited States |
Number of ASD Publications in 2000265 |
Number of ASD Publications in 20101040 |
Fold Growth From 2000 to 20103.9 |
Average Annual Increase in Number of Publications Since 200077.5 |
Rank in 20102 |
Author CountryUnited Kingdom |
Number of ASD Publications in 200094 |
Number of ASD Publications in 2010287 |
Fold Growth From 2000 to 20103.1 |
Average Annual Increase in Number of Publications Since 200019.3 |
Rank in 20103 | Author CountryCanada |
Number of ASD Publications in 200024 |
Number of ASD Publications in 2010137 |
Fold Growth From 2000 to 20105.7 |
Average Annual Increase in Number of Publications Since 200011.3 |
Rank in 20104 | Author CountryNetherlands |
Number of ASD Publications in 200013 |
Number of ASD Publications in 201097 |
Fold Growth From 2000 to 20107.5 |
Average Annual Increase in Number of Publications Since 20008.4 |
Rank in 20105 | Author CountryItaly |
Number of ASD Publications in 200022 |
Number of ASD Publications in 201086 |
Fold Growth From 2000 to 20103.9 |
Average Annual Increase in Number of Publications Since 20006.4 |
Rank in 20106 | Author CountryAustralia |
Number of ASD Publications in 200011 |
Number of ASD Publications in 201085 |
Fold Growth From 2000 to 20107.7 |
Average Annual Increase in Number of Publications Since 20007.4 |
Rank in 20107 | Author CountryFrance |
Number of ASD Publications in 200022 |
Number of ASD Publications in 201078 |
Fold Growth From 2000 to 20103.5 |
Average Annual Increase in Number of Publications Since 20005.6 |
Rank in 20108 | Author CountryGermany |
Number of ASD Publications in 20009 |
Number of ASD Publications in 201073 |
Fold Growth From 2000 to 20108.1 |
Average Annual Increase in Number of Publications Since 20006.4 |
Rank in 20109 | Author CountryJapan |
Number of ASD Publications in 200014 |
Number of ASD Publications in 201069 |
Fold Growth From 2000 to 20104.9 |
Average Annual Increase in Number of Publications Since 20005.5 |
Rank in 201010 | Author CountrySweden |
Number of ASD Publications in 20009 |
Number of ASD Publications in 201059 |
Fold Growth From 2000 to 20106.6 |
Average Annual Increase in Number of Publications Since 20005.0 |
Rank in 201011 | Author CountryIsrael |
Number of ASD Publications in 20007 |
Number of ASD Publications in 201035 |
Fold Growth From 2000 to 20105.0 |
Average Annual Increase in Number of Publications Since 20002.8 |
Rank in 201012 | Author CountryTurkey |
Number of ASD Publications in 20002 |
Number of ASD Publications in 201034 |
Fold Growth From 2000 to 201017.0 |
Average Annual Increase in Number of Publications Since 20003.2 |
Rank in 201013 | Author Country>China |
Number of ASD Publications in 20001 |
Number of ASD Publications in 201031 |
Fold Growth From 2000 to 201031.0 |
Average Annual Increase in Number of Publications Since 20003.0 |
Rank in 201014 | Author CountryBelgium |
Number of ASD Publications in 20006 |
Number of ASD Publications in 201029 |
Fold Growth From 2000 to 20104.8 |
Average Annual Increase in Number of Publications Since 20002.3 |
Rank in 201014 | Author CountrySpain |
Number of ASD Publications in 20006 |
Number of ASD Publications in 201029 |
Fold Growth From 2000 to 20104.8 |
Average Annual Increase in Number of Publications Since 20002.3 |
Rank in 201016 | Author CountryIreland |
Number of ASD Publications in 20006 |
Number of ASD Publications in 201025 |
Fold Growth From 2000 to 20104.2 |
Average Annual Increase in Number of Publications Since 20001.9 |
Rank in 201017 | Author CountryPoland |
Number of ASD Publications in 20000 |
Number of ASD Publications in 201021 |
Fold Growth From 2000 to 2010Not Applicable |
Average Annual Increase in Number of Publications Since 20002.1 |
Rank in 201018 | Author CountryTaiwan, Province of China |
Number of ASD Publications in 20001 |
Number of ASD Publications in 201020 |
Fold Growth From 2000 to 201020.0 |
Average Annual Increase in Number of Publications Since 20001.9 |
Rank in 201019 | Author CountryNorway |
Number of ASD Publications in 20003 |
Number of ASD Publications in 201019 |
Fold Growth From 2000 to 20106.3 |
Average Annual Increase in Number of Publications Since 20001.6 |
Rank in 201019 | Author CountryDenmark |
Number of ASD Publications in 20004 |
Number of ASD Publications in 201019 |
Fold Growth From 2000 to 20104.8 |
Average Annual Increase in Number of Publications Since 20001.5 |
Rank in 201019 | Author CountryBrazil |
Number of ASD Publications in 20000 |
Number of ASD Publications in 201019 |
Fold Growth From 2000 to 2010Not Applicable |
Average Annual Increase in Number of Publications Since 20001.9 |
Rank in 201022 | Author CountryIndia |
Number of ASD Publications in 20000 |
Number of ASD Publications in 201017 |
Fold Growth From 2000 to 2010Not Applicable |
Average Annual Increase in Number of Publications Since 20001.7 |
Rank in 201023 | Author CountrySwitzerland |
Number of ASD Publications in 20002 |
Number of ASD Publications in 201016 |
Fold Growth From 2000 to 20108.0 |
Average Annual Increase in Number of Publications Since 20001.4 |
Rank in 201024 | Author CountryKorea, Republic of |
Number of ASD Publications in 20001 |
Number of ASD Publications in 201014 |
Fold Growth From 2000 to 201014.0 |
Average Annual Increase in Number of Publications Since 20001.3 |
Rank in 201024 | Author CountryNew Zealand |
Number of ASD Publications in 20102 |
Number of ASD Publications in 200014 |
Fold Growth From 2000 to 20107.0 |
Average Annual Increase in Number of Publications Since 20001.2 |
Table 2. Top 25 Countries Publishing Autism Research in 2010. This table lists the top 25 countries publishing autism research in 2010 as well as publication counts by country in 2000 and 2010. The number of ASD publications produced in 2000 and 2010 is provided for comparison of publication activity in the last decade. In order to capture growth in publication rates by country, the two columns to the right contain the fold growth in publication number between 2000 and 2010 and the average annual increase in the number of publications produced per country since 2000. In cases where a single publication contained authors from multiple countries, the publication is counted for each country.
Figure 19 and Figure 20 further illustrate changes in autism publication activity across countries. Figure 19 shows the total number of ASD publications for the last 30 years by country. Publications are counted on a "whole-count basis," where each collaborating country is credited one count; therefore, multiple counting can occur if more than one country contributes to a publication. The top five countries are graphed individually and the remaining countries are grouped together and graphed as a single line, called "All Other Countries." While the US and UK have consistently demonstrated the highest levels of single country outputs, there has been a recent pronounced increase in publications produced by researchers outside of the top five countries.
Global Growth in Autism Publications by Country, 1980 to 2010
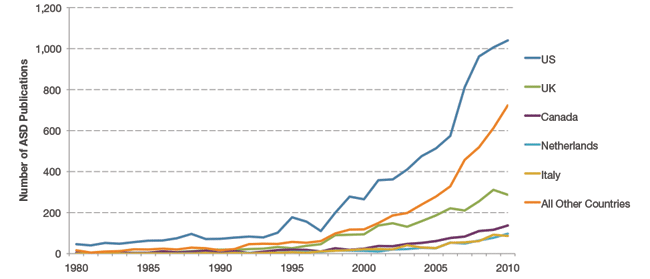
Figure 19. Global Growth in Autism Publications by Country, 1980 to 2010. The total publication counts by country since 1980 are shown above, with the US producing the most publications (blue line). The next highest producer is the combined category that includes all countries that are not among the top five (orange line). Researchers in these countries have sharply increased their publications output since 2000. Publications are counted on a "whole-count basis," where each collaborating country is credited one count; therefore, multiple counting can occur if more than one country contributes to a publication. For example, if there are three authors listed on a publication, two from the US and one from UK, the publication would be counted twice, once for the US and once for the UK.
A distinct trend towards globalization of ASD research is demonstrated further in Figure 20, which plots each country's share of the annual world autism publication output from 1980 to 2010. To determine a country's share of total annual autism publications, publications are counted on a "whole-count basis," where each collaborating country is credited one count. This method shows the full contribution of each country without penalizing for international collaboration. Each country's count is divided by the total number of publications in that year to determine the country's annual share, and can therefore add up to more than 100%. A more complete description of methodology for calculating world share and a discussion of alternative methods that may be useful in future analyses is provided in Appendix VIII. Results of the analysis show that the collective share of the top five countries has been decreasing since 1980, while the share of the remaining countries (collectively called "All Other Countries") has been increasing.
Author Countries for ASD-Related Publications as a Share of the World Total, 1980 to 2010
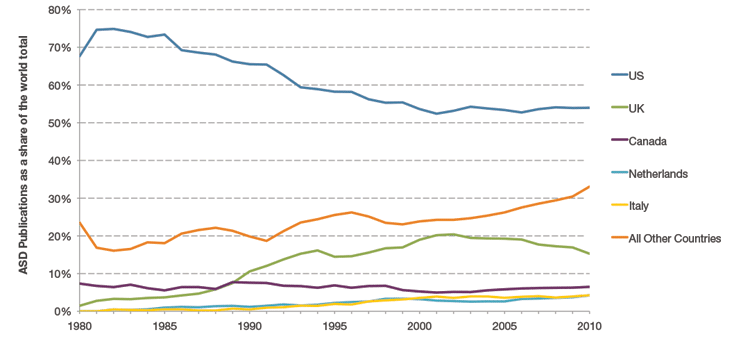
Figure 20. Author Countries for ASD-Related Publications as a Share of the World Total, 1980 to 2010. While the world share of autism publications is increasing in countries like Italy (yellow line) and the Netherlands (teal line), the US share has decreased since 1980. Increases are also observed among countries outside the top five most prolific (collectively represented by the orange line). Publications are counted on a "whole-count basis," where each collaborating country is credited one count; therefore, multiple counting can occur if more than one country contributes to a publication and percentages can be greater than 100.
The countries with the highest fold growth since 2000 (provided in Table 2) are some of the primary contributors to the increasing share seen among All Other Countries – particularly China, Taiwan, South Korea, India, Poland, and Brazil. These data suggest a broadening of international autism research, and this trend is not unique to autism. The National Science Foundation's Science and Engineering Indicators 2012 published growth curves of global research outputs, demonstrating that many countries with developing economies are greatly increasing their research activity, particularly in Asia and South America.29 Likewise, the world share of US publications across much broader science and engineering disciplines has continued to decrease in the last 15 years, and in 2010 the US accounted for approximately 28% of all science and engineering articles. In the related Journal Subject Categories utilized in this study as a closely related comparison group, the US share of publications has also been on a steady decline since 1980 and now accounts for approximately 39% of the world share, substantially lower than the 53% share observed among the focused subset of 2010 autism publications. Given broader research trends towards increased globalization of scientific output, increasing global awareness of and focus on autism as an important health issue, and potential opportunities to develop commercializable products and technologies to help people with ASD, it is likely that a number of countries with traditionally smaller research capacities will continue to increase their autism research activities and world share of autism publications in coming years.
Are international collaborations increasing and do they result in higher impact research?
As shown previously in Figure 18, a number of investigators from different countries are producing collaborative publications. To examine whether international collaboration in autism research is increasing, author network analyses were conducted to visualize the number of countries participating in international collaborations. Figure 21 shows collaboration network maps for five specific years (1990, 1995, 2000, 2005, and 2010). All countries that have published autism research since 1990 are nodes on the edge of the circular network. A line, or link, between these nodes indicates a publication with authors from both countries. These network maps illustrate that not only are author collaborations growing, but more and more countries are involved in international autism collaborations.
International Autism Publication Collaboration Networks in 1990, 1995, 2000, 2005, and 2010

Figure 21. International Autism Publication Collaboration Networks in 1990, 1995, 2000, 2005, and 2010. All countries publishing autism research in any year from 1990 to 2010 are represented by the smaller network of circles, or nodes, forming the boundary of the larger circles. Each line between two country nodes indicates a publication with authors from both countries within that time period. The collaboration networks clearly show a dramatic increase in international collaboration between 1990 and 2010.
Similarly, Figure 22 (top left) shows the total number of ASD publications from 1980 to 2010 produced by authors in only one country (blue line) and authors in multiple countries (orange line). Both groups have increased substantially since the mid- to late 1990s. Figure 22 (bottom right) shows the proportion of autism publications authored by researchers in more than one country (blue line), demonstrating a clear increase from near zero in 1980 to over 20% in 2010. It appears that one out of every five autism research articles currently published is the product of international research collaboration. For comparison, the proportion of publications resulting from international collaborations in the grouping of broader Journal Subject Categories, mentioned in Chapter One and described in Appendix III, is also shown (orange line). While the trends are very similar, the autism field generally has been engaging in less international research collaboration than broader scientific fields. One interpretation is that ASD research still lags a bit behind broader scientific fields in its extent of globalization and international collaboration, possibly due to the relatively earlier phase of development of the autism research field.
Extent of International Collaboration in Autism Research, 1980 to 2010
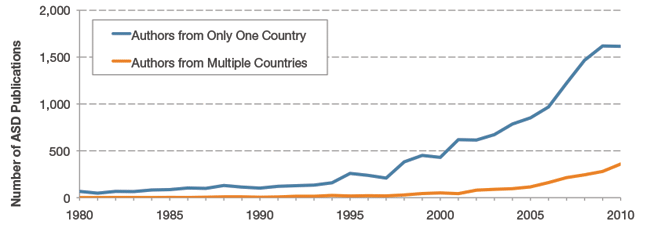
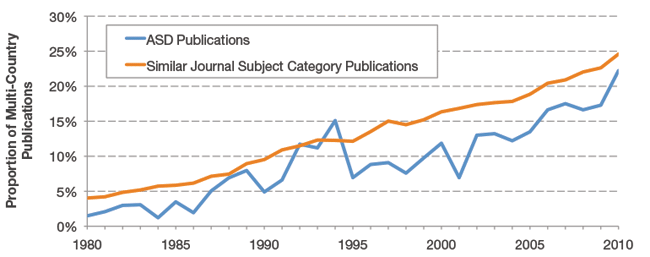
Figure 22. Extent of International Collaboration in Autism Research, 1980 to 2010. The number (top left) and proportion (bottom right) of autism research papers with authors from multiple countries is shown from 1980 to 2010. The volume graph to the left shows that the number of publications from a single country (blue line) and publications stemming from multi-country collaborations (orange line) have increased appreciably since the mid- to late-1990s. The graph to the right plots the proportion of autism publications with authors from multiple countries (blue line) compared with the corresponding proportion in the related comparison group defined by the similar Journal Subject Category publications (orange line). Both groups demonstrate a distinct increase in international collaboration, though ASD publications generally demonstrated a lower proportion of multi-country publications than broader research fields.
To determine whether the involvement of investigators from multiple countries results in higher impact publications, the average 2-year times cited for internationally collaborative versus single country publications were determined. Figure 23 shows that autism publications with authors from more than one country are consistently cited more often than those from a single country. While these data are preliminary and further, more rigorous analyses would be needed to demonstrate whether this trend is upheld when controlled for variables such as author and institution number, the trend shown here suggests that international, collaborative publications may be reaching more researchers and therefore impacting a larger portion of the research community.
Impact of Collaborative International Autism Publications, 1995 to 2009
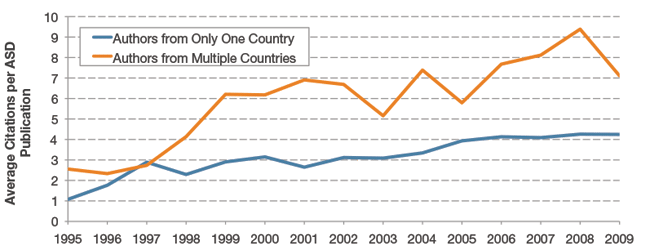
Figure 23. Impact of Collaborative International Autism Publications, 1995 to 2009. The average 2-year citations for publications with authors from a single country (blue line) compared to those from multiple countries (orange line) show that publications with authors from multiple countries receive more citations, indicating that publications authored by international collaborations may be having greater impact over time. Self-citations are not included in the 2-year citation count.
Combined, all of these collaboration indicators, including the number of countries participating in research across national borders, the share of publications with international authors, and the suggested high impact of publications resulting from international collaboration may have key implications. First, as the autism research field expands, researchers across numerous countries are increasingly collaborating and publishing together. Second, since these collaborations appear to be producing publications that are cited more often, it suggests that the results of these collaborations may be reaching more researchers across the global community and may have higher influence within the field. The observation that international collaborations represent a smaller proportion of ASD publications than what is found in the collection of comparable Journal Subject Categories covering a broader array of science may be another sign that the autism field is still in a relatively early stage of development. Observations from the this section and the previous section showing that more countries are becoming more involved in autism research over time suggests that opportunities for international collaboration will continue to increase for some time to come.
Which research institutions are publishing the most research?
More than 1,800 institutions worldwide published autism research in 2010. Table 3 displays the 25 research institutions that published the greatest number of autism research articles in 2010. Seventeen of the top 25 institutions are in the US, but autism research is also concentrated in institutions in the UK, Netherlands, Canada, and Sweden. The vast majority of top-publishing institutions are universities, but there is one non-university institution in the top 25 – the US government's National Institute of Mental Health, an institute of the NIH. Also noteworthy is that seven of the top-publishing US universities are hosts of NIH-funded Autism Centers of Excellence, including the University of North Carolina, University of California Los Angeles, University of Washington, Yale University, University of California Davis, University of California San Diego, and the University of Pittsburgh.xi
Top 25 Institutions Publishing Autism Research Globally in 2010
| Rank | Institution | Country | Total Publications |
|---|---|---|---|
Rank1 |
InstitutionHarvard University |
CountryUnited States |
Total Publications46 |
Rank2 |
InstitutionUniversity of North Carolina |
CountryUnited States |
Total Publications44 |
Rank3 |
InstitutionKing's College London |
CountryUnited Kingdom |
Total Publications42 |
Rank4 |
InstitutionUniversity of California Los Angeles |
CountryUnited States |
Total Publications39 |
Rank5 |
InstitutionRadboud University Nijmegen |
CountryNetherlands |
Total Publications36 |
Rank6 |
InstitutionUniversity of Washington |
CountryUnited States |
Total Publications34 |
Rank6 |
InstitutionYale University |
CountryUnited States |
Total Publications34 |
Rank6 |
InstitutionUniversity of California Davis |
CountryUnited States |
Total Publications34 |
Rank9 |
InstitutionUniversity of Wisconsin |
CountryUnited States |
Total Publications33 |
Rank10 |
InstitutionMcGill University |
CountryCanada |
Total Publications30 |
Rank11 |
InstitutionUniversity College London |
CountryUnited Kingdom |
Total Publications29 |
Rank11 |
InstitutionUniversity of Pennsylvania |
CountryUnited States |
Total Publications29 |
Rank13 |
InstitutionNational Institute of Mental Health |
CountryUnited States |
Total Publications29 |
Rank14 |
InstitutionLouisiana State University |
CountryUnited States |
Total Publications27 |
Rank15 |
InstitutionUniversity of Gothenburg |
CountrySweden |
Total Publications26 |
Rank16 |
InstitutionVanderbilt University |
CountryUnited States |
Total Publications25 |
Rank17 |
InstitutionUniversity of California San Diego |
CountryUnited States |
Total Publications24 |
Rank17 |
InstitutionOhio State University |
CountryUnited States |
Total Publications24 |
Rank17 |
InstitutionBoston University |
CountryUnited States |
Total Publications24 |
Rank20 |
InstitutionUniversity of Toronto |
CountryCanada |
Total Publications23 |
Rank20 |
InstitutionColumbia University |
CountryUnited States |
Total Publications23 |
Rank22 |
InstitutionKarolinska Institute |
CountrySweden |
Total Publications22 |
Rank22 |
InstitutionUniversity of Pittsburgh |
CountryUnited States |
Total Publications22 |
Rank22 |
InstitutionUniversity of Utah |
CountryUnited States |
Total Publications22 |
Rank25 |
InstitutionUniversity of Montreal |
CountryCanada |
Total Publications21 |
Table 3. Top 25 Institutions Publishing Autism Research Globally in 2010. This table, listing the institutions that published the most autism research in 2010, shows that institutions worldwide are making significant contributions to the autism field. Each of the top 25 most prolific universities and institutions are included, along with their country and the number of 2010 publications.
Do institutional collaborations result in higher impact research?
Similar to examining the citation impact of collaboration between countries, citation counts were also used to assess the influence of publications resulting from institutional collaboration identified by using author address data. Results showed that as the number of institutions per publication increases, there is a corresponding increase in the average number of times a publication is cited (Figure 24). These results parallel the findings concerning international collaborations and lend additional support to the hypothesis that, within the ASD field, when institutions share knowledge and resources, publication outcomes are strengthened. Other studies have also demonstrated a growing trend toward multi-institutional collaboration in virtually all fields of science, engineering, and social science, and further show that collaboration tends to result in more highly-cited publications.30,31
Impact of Collaborative Publications with Authors from Multiple Institutions, 2000 to 2010
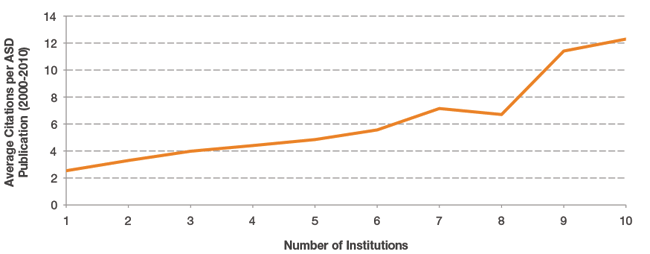
Figure 24. Impact of Collaborative Publications with Authors from Multiple Institutions, 2000 to 2010. The graph above illustrates the correlation of the 2-year average times cited with the number of institutions collaborating on the same research publication for all publications from 2000 to 2010. There is an increase in the average number of citations as the number of institutions involved in the research increases.
Which US states are publishing autism research?
As noted previously, more than 50% of 2010 autism publications were authored by at least one researcher at a US institution. US publications were examined in more detail by mapping the total number of publications at the State level and also measuring the extent of institutional and international collaboration in the subset of papers that included US authors.
Figure 25 illustrates the pattern of publication density across the US, which may reflect several key factors including population, centers of research activity, and levels of government funding for research. Due to variations in these factors, research outputs vary widely from state to state. California, Massachusetts, and New York are the most prolific autism research publishing states; they are also the top three recipients of Federal health-related research dollars.xii
State by State Number of US Autism Publications in 2010
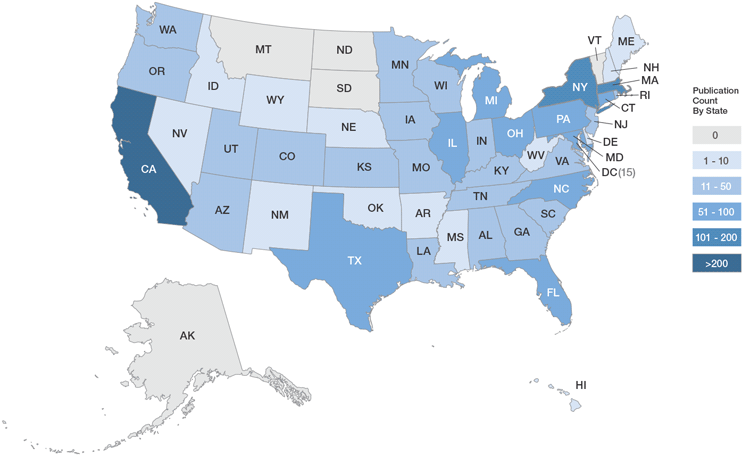
Figure 25. State by State Number of US Autism Publications in 2010. Increasingly darker shades of blue indicate increasing volumes of State-level autism publications. California, Massachusetts, and New York are the states publishing the largest volume of autism research articles. States in gray were not linked to any autism-relevant publications in 2010.
Are US researchers engaging in more institutional and international collaboration?
To determine the extent to which US researchers are collaborating with investigators at other US institutions and abroad, ASD research publications with authors located in the US were grouped into three categories. The first category contains publications from a single US institution. The other two categories contain multi-institution publications, either between multiple institutions within the US (but not non-US institutions) or between US and non-US institutions, indicating a US-International collaboration. Figure 26 shows the number of publications produced in these three respective categories (top left) and the proportion of total for publications from 1980 to 2010 (bottom right). From 1998 onwards, the publication rate of articles in all three categories increased. Before the mid-2000s, it was more common for publications to result from US researchers working within the boundaries of a single institution (shown in blue). In the last few years, however, that trend has reversed – publications from single US Institutions only accounted for 40% of 2010 autism research articles, and it is now more common for US investigators to publish with collaborators at other universities in the US and abroad. Both categories of multi-institution publications have increased, especially since 2000, and combined they accounted for 60% of all ASD publications with US authors in 2010. Publications from multiple institutions in the US (shown in green) have doubled, increasing from approximately 20% in 1995 to 40% in 2010. In that same time period, collaborative US-International publications also doubled, up from around 10% to 20%. Given the strong recent trends in multi-institution publications in the US autism research field, collaborative projects should continue to play an influential role in the future.
Extent of Institutional and International Collaboration in US Autism Research, 1980 to 2010
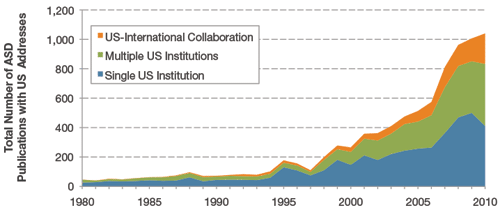

Figure 26. Extent of Institutional and International Collaboration in US Autism Research, 1980 to 2010. The number (top left) and proportion (bottom right) of US-authored publications from 1980 to 2010 that were affiliated with a single US institution (blue), multiple US institutions (green), or a US plus a non-US institution (orange). For the stacked area graph (left), the total area that is shown in color represents the total number of publications per year from 1980 to 2010. This has been divided into three portions, representing the respective publication counts within each of the three categories. There has been an increase in the number of publications in all three categories since the late 1990s, culminating in 2010 with 40% of the publications coming from single US institutions, 40% from multiple US institutions and 20% from collaborations between US and international institutions. The line graph to the right shows that while single institution publications, at one time, made up the largest proportion of US publications, the number of multiple institution publications is now larger, accounting for a combined 60% (i.e., the combined total of "Multiple US Institutions" and "US-International Collaboration") – driven both by an increase in the proportion of publications from multiple institutions in the US and the proportion of publications resulting from US-International collaborations.
In conclusion, similar trends toward increasing collaboration in autism research are evident in the United States and abroad. Increasing institutional and international collaboration is likely supporting the rise of knowledge creation and exchange among institutions and across national boundaries. Investigators, institutions and funders should continue to encourage and support collaboration, as sharing intellectual and research resources has the potential to accelerate research progress.
Main findings from analysis of global autism publications and collaborations
- In 2010, autism research was published by authors in over 50 countries and more than 1,800 research institutions worldwide.
- Since 1980, US investigators consistently have been the largest producers of autism publications, but the US's share of autism research has declined over time, stabilizing to around half of the world share in 2010.
- In the last decade, the share of publications from countries outside of the top 5 publishers has increased. Leading this trend are many developing countries in Asia, especially China, Taiwan, South Korea, and India, as well as Poland and Brazil.
- Collaborative publications, either between multiple countries or multiple institutions, are increasing and are also more highly cited than publications with authors from only one country or only one institution, suggesting that international and multi-institution research efforts may have a higher impact in the autism field.
- Multi-institutional publications, consisting of authors at different institutions within the US as well as US institutions collaborating with non-US institutions, are now more common than those produced from authors located at a single US institution.


