
Report to Congress
on Activities Related to Autism Spectrum Disorder and Other Developmental Disabilities
FY 2014 - FY 2018

Prevalence of Autism Spectrum Disorder
This section addresses Subsection (C) of 399DD: "Information on the incidence and prevalence of autism spectrum disorder, including available information on the prevalence of autism spectrum disorder among children and adults, and identification of any changes over time with respect to the incidence and prevalence of autism spectrum disorder." Information on the prevalence of ASD is provided by the CDC, ED, and HRSA.
Centers for Disease Control and Prevention
The CDC surveillance efforts reported in this section provide current ASD prevalence information rather than incidence. Incidence measures are typically more limited and indicate the number of newly diagnosed people with a disorder during a specific time period. In comparison, prevalence data indicate the total number of people affected at any given time in the population studied. Given the variability in the age of diagnosis of ASD and that not all children identified by the CDC surveillance efforts have a documented diagnosis, capturing prevalence, rather than incidence, is a more complete method for estimating the impact of ASD in the population. To maintain the ability to track trends over time and to ensure the most complete count of the disorder among the population, CDC continues to report prevalence rather than incidence of the condition.
CDC's autism surveillance provides important information on the numbers of children affected with ASD and helps describe the characteristics of the population. Surveillance tracks trends over time and is an essential building block for population-based research—providing clues about potential risk factors that warrant further study. Surveillance also provides critically important data for communities to use when planning for services. Ultimately, surveillance helps evaluate the progress of prevention and intervention programs.
| Identified Prevalence of Autism Spectrum DisorderADDM Network 2000-2014, Combining Data from All Sites | ||||
|---|---|---|---|---|
| Surveillance Year | Birth Year | Number of ADDM Sites Reporting | Prevalence per 1,000 Children (Range) | This is about 1 in X children |
Surveillance Year2000 |
Birth Year1992 |
Number of ADDM Sites Reporting6 |
Prevalence per 1,000 Children (Range)6.7(4.5-9.9) |
This is about 1 in X children1 in 150 |
Surveillance Year2002 |
Birth Year1994 |
Number of ADDM Sites Reporting14 |
Prevalence per 1,000 Children (Range)6.6(3.3-10.6) |
This is about 1 in X children1 in 150 |
Surveillance Year2004 |
Birth Year1996 |
Number of ADDM Sites Reporting8 |
Prevalence per 1,000 Children (Range)8.0(4.6-9.8) |
This is about 1 in X children1 in 125 |
Surveillance Year2006 |
Birth Year1998 |
Number of ADDM Sites Reporting11 |
Prevalence per 1,000 Children (Range)9.0(4.2-12.1) |
This is about 1 in X children1 in 110 |
Surveillance Year2008 |
Birth Year2000 |
Number of ADDM Sites Reporting14 |
Prevalence per 1,000 Children (Range)11.3(4.8-21.2) |
This is about 1 in X children1 in 88 |
Surveillance Year2010 |
Birth Year2002 |
Number of ADDM Sites Reporting11 |
Prevalence per 1,000 Children (Range)14.7(5.7-21.9) |
This is about 1 in X children1 in 68 |
Surveillance Year2012 |
Birth Year2004 |
Number of ADDM Sites Reporting11 |
Prevalence per 1,000 Children (Range)14.6(8.2-24.6) |
This is about 1 in X children1 in 68 |
Surveillance Year2014 |
Birth Year2006 |
Number of ADDM Sites Reporting11 |
Prevalence per 1,000 Children (Range)16.8(13.1-29.3) |
This is about 1 in X children1 in 59 |
Table 14. ASD prevalence data from CDC's Autism and Developmental Disabilities Monitoring (ADDM) Network.
The ADDM Network has estimated prevalence of ASD among 8-year-old children every two years since 2000 in communities located in states across the United States; states that participated in at least one surveillance year include Alabama, Arizona, Arkansas, Colorado, Florida, Georgia, Maryland, Minnesota, Missouri, New Jersey, North Carolina, Pennsylvania, South Carolina, Tennessee, Utah, West Virginia, and Wisconsin. Estimated ASD prevalence at age 8 has ranged from 1 in 150 children born in 1992 and 1994 to 1 in 68 children born in 2004. The ADDM Network published a new report for surveillance year 2014, showing that the estimated prevalence in 11 participating communities was 1 in 59 for 8-year-olds born in 2006. ADDM Network data have shown significant variation in ASD prevalence by geographic area, sex, race/ethnicity, and level of intellectual ability. Among children with ASD, the ratio of boys to girls had remained consistent over time with boys having approximately 4.5 times the prevalence of girls, although in the recent ADDM report, the ratio was closer to four boys to one girl. Notably, the percentage of children with ASD who also have ID has decreased substantially, from 46-62% in 2000 to 31% in 2014, likely reflecting greater identification of children with ASD who have average to above-average cognitive function. Estimated prevalence has been higher in surveillance sites where education records were reviewed in addition to health records, underscoring the role of special education systems in providing comprehensive evaluations and services to children with DD. Non-Hispanic white children are more likely to be identified with ASD, but the prevalence gap is narrowing between non-Hispanic white children and other races/ethnicities. In the most recent data, non-Hispanic white children were less than 10% more likely to be identified with ASD compared with non-Hispanic black children (previously was 20% more likely). Similarly, non-Hispanic white children were 20% more likely to be identified with ASD compared with Hispanic children (previously was 50% more likely). This reduction in the prevalence disparity for non-Hispanic black and Hispanic children may be due to more effective outreach directed toward minority communities and efforts to have all children screened for ASD.
Disparities by race/ethnicity in estimated ASD prevalence, particularly for Hispanic children, suggest that access to treatment and services might be lacking or delayed for some children. If prevalence disparities by race/ethnicity reflect under-identification of black and Hispanic children rather than differences in risk factors, estimated ASD prevalence may continue to rise as identification increases among these children. One report on ADDM data published in 2010 suggests that these disparities in identified prevalence may be associated with socioeconomic status. Differences in heritable factors as well as exposure to various risk and protective factors may also influence differences in identified prevalence among certain groups, so ongoing monitoring is needed to better understand these factors.
Data from the ADDM Network show an increase in the identified prevalence of ASD between 2000 (6.7 per 1,000 children) and 2014 (16.8 per 1,000 children). These results are based on the average prevalence from all participating sites during a specific year; however, the composition of sites and the specific geographical areas within each site have varied over time. Therefore, a rigorous analysis was undertaken to assess prevalence trends for a group of sites with data from both 2002 and 2008, restricted to the common geographic areas for each year, showing a 78% increase in estimated ASD prevalence between 2002 and 2008. No single factor explains the changes identified in ASD prevalence over time and much needs to be done to understand the relative contribution of the multiple factors involved, including improved identification and awareness. Whether identified ASD prevalence estimates will plateau, decrease, or continue to increase is unknown and continued examination of ASD prevalence changes is important.
In 2010, CDC funded six sites to expand ADDM methodology to younger children. Through Early ADDM surveillance of ASD among 4-year-old children, CDC can better understand the population characteristics of young children affected by ASD and better inform early identification efforts. To understand ASD prevalence, it is important to identify children who have the diagnosis and children who have the symptoms (but do not yet have a diagnosis). Expanded surveillance of 4-year-olds can provide a more complete picture of the impact of ASD; however, it is particularly important to note that because methods are dependent on record review, prevalence estimates are impacted by the age at which children are evaluated for developmental concerns. Continued monitoring of ASD among 8-year-olds, previously shown to be "peak prevalence," or the age at which most children have been identified, is essential to understanding the complex changes occurring in ASD over time.
In May 2013, the American Psychiatric Association released the 5th edition of the Diagnostic and Statistical Manual of Mental Disorders (DSM) with revised diagnostic criteria for ASD. In 2014, investigators from CDC and the ADDM Network completed an evaluation of the new diagnostic criteria for ASD (DSM-5) to estimate the impact on prevalence estimates originally based on the last iteration (DSM-IV-TR) criteria. Currently, CDC is applying both DSM-IV-TR and DSM-5 diagnostic criteria to generate prevalence estimates based on the different surveillance case definitions and evaluate the impact on prevalence trends. Thus, CDC has been able to evaluate the effect of changes in diagnostic criteria. The current DSM-5 criteria consider children with a well-established DSM-IV-TR ASD diagnosis to meet DSM-5 diagnostic criteria as well, regardless of behavioral symptoms displayed, in order to provide continuity of services. CDC surveillance methods are able to distinguish between children meeting DSM-5 behavioral criteria for ASD and those who met DSM-5 criteria solely through a previous ASD diagnosis, thus providing estimates of the proportion of children who would not have an ASD diagnosis under DSM-5 without the provision for children with a previous diagnosis. This provides important information about the effect of the change to DSM-5 criteria on ASD prevalence, since moving forward fewer children will have been evaluated and diagnosed under DSM-IV-TR criteria. The report, including the comparison of prevalence estimates based on DSM-IV-TR and DSM-5 surveillance criteria was published in spring 2018. It reported that ASD prevalence was similar, although about 4% higher among children who met the surveillance case definition based on DSM-IV-TR compared with the ASD prevalence among children who met the surveillance case definition based on DSM-5. It may be too soon to determine the long-term impact of the changes in the diagnostic criteria on ASD prevalence and characteristics, so CDC will continue to monitor this in the next ADDM Network report.
Department of Education
The Office of Special Education Programs (OSEP) collects data from States on the number of students with ASD that receive services under the Individuals with Disabilities Education Act (IDEA), Part B. These and other data are reported in the 39th Annual Report to Congress on IDEA, 2017.
| Students with ASD served under IDEA, Part B | ||||
|---|---|---|---|---|
| Year | Age 6-11 | Age 12-17 | Age 18-21 | Ages 6-21 |
Year2012 |
Age 6-11231,165 |
Age 12-17179,020 |
Age 18-2133,809 |
Ages 6-21443,994 |
Year2013 |
Age 6-11244,272 |
Age 12-17198,653 |
Age 18-2136,058 |
Ages 6-21478,983 |
Year2014 |
Age 6-11257,714 |
Age 12-17217,960 |
Age 18-2138,014 |
Ages 6-21513,688 |
Year2015 |
Age 6-11271,175 |
Age 12-17238,607 |
Age 18-2140,623 |
Ages 6-21550,405 |
Year2016 |
Age 6-11282,842 |
Age 12-17252,477 |
Age 18-2143,446 |
Ages 6-21578,765 |
Table 15. Number of children ages 6-21 with Autism served under IDEA, Part B, by year: Fall 2012 through fall 2016
| Percentage of the population ages 6 through 21 with ASD served under IDEA, Part B, by year | ||||||||||
|---|---|---|---|---|---|---|---|---|---|---|
| Disability | 2006 | 2007 | 2008 | 2009 | 2010 | 2011 | 2012 | 2013 | 2014 | 2015 |
DisabilityAutism |
20060.3 |
20070.4 |
20080.4 |
20090.5 |
20100.5 |
20110.6 |
20120.7 |
20130.7 |
20140.8 |
20150.8 |
Table 16. Percentage of the population ages 6 through 21 with Autism served under IDEA, Part B, by year: Fall 2006 through fall 2015. Percentage was calculated by dividing the number of students ages 6 through 21 served under IDEA, Part B, in the disability category in the year by the estimated U.S. resident population ages 6 through 21 for that year, then multiplying the result by 100.
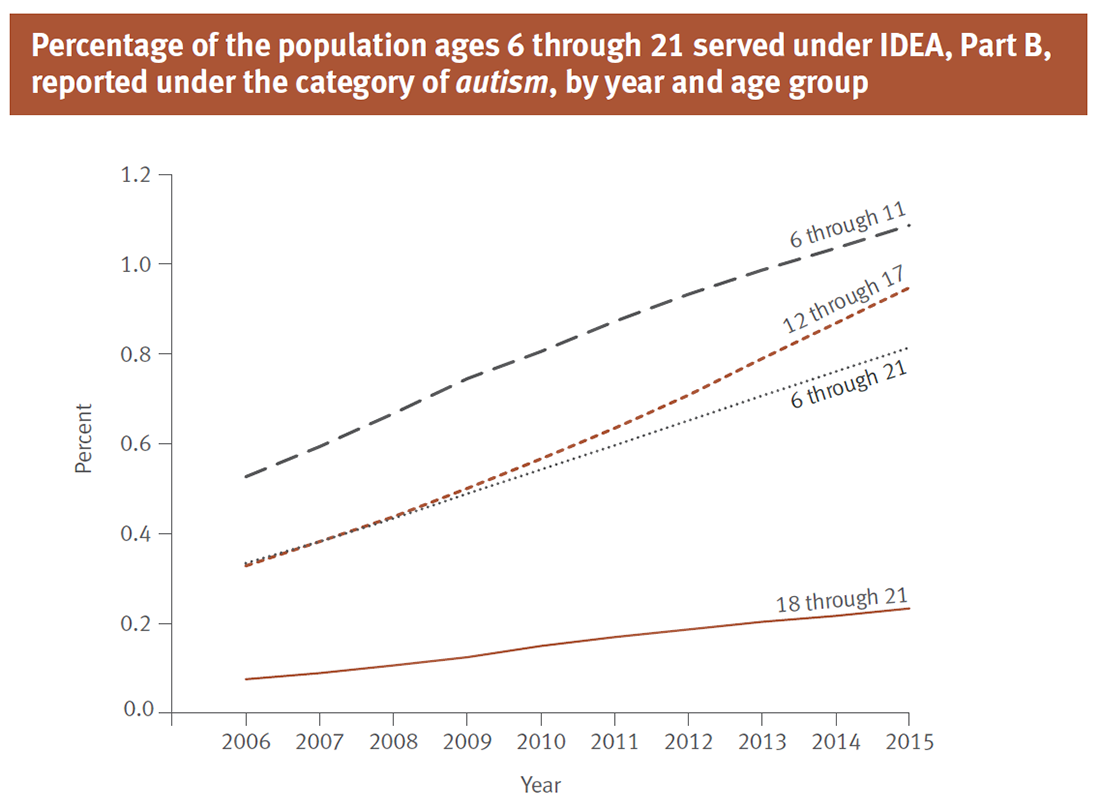
Figure 1. Percentage of the population ages 6 through 21 served under IDEA, Part B, reported under the category of autism, by year and age group: Fall 2006 through Fall 2015. Percentage was calculated by dividing the number of students ages 6 through 21 served under IDEA, Part B, in the disability category in the year by the estimated U.S. resident population ages 6 through 21 for that year, then multiplying the result by 100.
Notes:
- Children aged 6 through 11 make up the largest age group reported under the category of autism.
- Since 2011, children aged 12 through 17 have been reported under the category of autism at a pace greater than that of the other age groups during this time.
Health Resources and Services Administration
Data from the 2016 National Survey of Children's Health (NSCH) indicates that among U.S. children aged 3-17 years, 2.5% had ever received an ASD diagnosis and currently had the condition. This percentage is based on a sample of 43,021 children whose parents completed the survey.
The NSCH is a cross-sectional survey and thus does not provide incidence data. In 2016, the NSCH was significantly redesigned; changes were made in the survey's mode of data collection and sampling frame, as well as adjustments to item wording. Therefore, comparisons to previous NSCH data should not be made.